Blog


RSS

Market Update.

Housing Market Activity Uneven Across BC Regions.

Vancouver, BC – August 13, 2026.

The British Columbia Real Estate Association (BCREA) reports that 6,561 residential unit sales were recorded in Multiple Listing Service® (MLS®) Systems in July 2026, down 6.7 per cent from July 2025. The average MLS® residential price in BC in July 2026 was down 1.3 per cent at $929,619 compared to $942,247 in July 2025.

chart

Total MLS® residential sales dollar volume was $6.1 billion, down 7.9 per cent from the same time the previous year. BC MLS® unit sales were 18.8 per cent lower than the ten-year average for the month of July.

“Seasonally adjusted sales activity rose from the previous month across most of BC, while weaknesses remained concentrated in the Lower Mainland,” said BCREA Chief Economist Brendon Ogmundson. “Looking ahead, resilience in the economy and a recovering labour market should translate to regional markets converging to long-term averages over the next year.”

Year-to-date, BC residential sales dollar volume is down 6.7 per cent to $38.04 billion, compared with the same period in 2025. Residential unit sales are down 5.6 per cent year-over-year at 40,432 units, while the average MLS® residential price is also down 1.2 per cent to $940,948.

Read

Market Review.

Home sales lose brief momentum.

August 5, 2026.


Home sales registered on the MLS® in Metro Vancouver* fell nearly ten per cent relative to July last year, erasing the ten percent gain seen in June that kicked off the summer.

 The Greater Vancouver REALTORS® (GVR) reports that residential sales in the region totalled 2,061 in July 2026, a 9.8 per cent decrease from the 2,286 sales recorded in July 2025. This was 18.6 per cent below the 10-year seasonal average (2,532).

 “Last month, we reported broad gains in home sales across all home types, raising the question of whether demand would continue to build into the summer. Instead, July sales were down nearly ten per cent, led by an 18 per cent drop in apartment sales, confirming to market watchers that the June momentum was not sustained,” said Andrew Lis, GVR chief economist and vice-president data analytics. “Over the past few years, the sales activity story has often been one step forward, one step back, and the June and July data are a prime example of this pattern.”

 There were 4,991 detached, attached and apartment properties newly listed for sale on the Multiple Listing Service® (MLS®) in Metro Vancouver in July 2026. This represents a 11.5 per cent decrease compared to the 5,642 properties listed in July 2025. This figure matches the 10-year seasonal average (4,992).

 The total number of properties currently listed for sale on the MLS® system in Metro Vancouver is 16,476, a 4 per cent decrease compared to July 2025 (17,168). This is 26.8 per cent above the 10-year seasonal average (12,992).

 Across all detached, attached and apartment property types, the sales-to-active listings ratio for July 2026 is 13 per cent. By property type, the ratio is 10.5 per cent for detached homes, 15.8 per cent for attached, and 14 per cent for apartments.

Analysis of the historical data suggests downward pressure on home prices occurs when the ratio dips below 12 per cent for a sustained period, while home prices often experience upward pressure when it surpasses 20 per cent over several months.

 “Sales weren’t the only metric taking a step back in July, however. New listings were also down 11 percent in July, largely due to a nearly 17 per cent drop in apartment listings,” said Lis. “We’ve been pointing to the slowdown in sellers coming to market for several months, and it’s beginning to translate into a gradual decline in the overall inventory level. This shift remains in early days, and with sales in a holding pattern, price pressures of significance in either direction aren’t showing up in the data quite yet, with prices down roughly one per cent in July.”

 The MLS® Home Price Index composite benchmark price for all residential properties in Metro Vancouver is currently $1,088,800. This represents a 6.2 per cent decrease over July 2025 and a 0.9 per cent decrease compared to June 2026.

 Sales of detached homes in July 2026 reached 639, a 3.2 per cent decrease from the 660 detached sales recorded in July 2025. The benchmark price for a detached home is $1,822,900. This represents a 7 per cent decrease from July 2025 and a 1.1 per cent decrease compared to June 2026.

 Sales of apartment homes reached 952 in July 2026, a 17.8 per cent decrease compared to the 1,158 sales in July 2025. The benchmark price of an apartment home is $688,000. This represents a 7.5 per cent decrease from July 2025 and a one per cent decrease compared to June 2026.

 Attached home sales in July 2026 totalled 454, a 1.1 per cent decrease compared to the 459 sales in July 2025. The benchmark price of a townhouse is $1,030,400. This represents a 6 per cent decrease from July 2025 and a 1.5 per cent decrease compared to June 2026.


Read

Market Update.

Market Activity Shows Encouraging Signs of Improvement.

Vancouver, BC – July 13, 2026
.


The British Columbia Real Estate Association (BCREA) reports that 7,225 residential unit sales were recorded in Multiple Listing Service® (MLS®) Systems in June 2026, up 0.9 per cent from June 2025. The average MLS® residential price in BC in June 2026 was down 0.8 per cent at $946,878 compared to $954,712 in June 2025.


chart


Total MLS® residential sales dollar volume was $6.84 billion, up 0.1 per cent from the same time the previous year. BC MLS® unit sales were 18.4 per cent lower than the ten-year average for the month of June.

“Sales rose year-over-year in June for the first time since September 2025, driven by stronger activity in the Greater Vancouver area,” said BCREA Chief Economist Brendon Ogmundson. “We hope this marks the beginning of a stronger second half of the year across BC housing markets as sales converge to more normal levels following several years of unexpected global shocks.”

Year-to-date, BC residential sales dollar volume is down 6.4 per cent to $31.96 billion, compared with the same period in 2025. Residential unit sales are down 5.4 per cent year-over-year at 33,886 units, while the average MLS® residential price is also down 1.1 per cent to $943,249.


table
Read

Market Review.

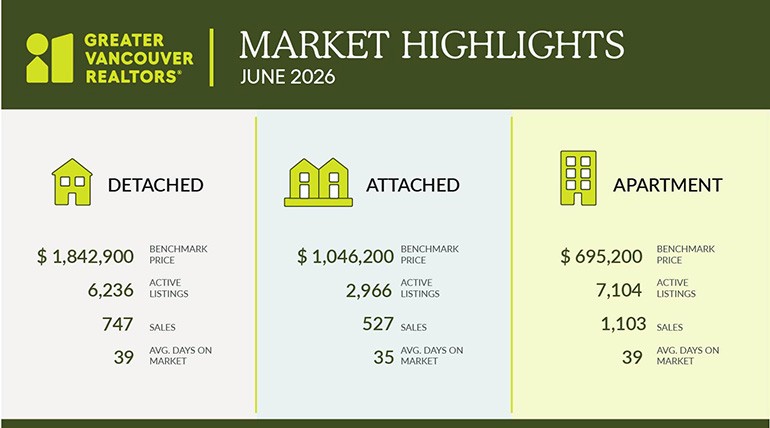
Greater Vancouver home sales pick up at the start of summer.

July 3, 2026.


Demand for all home types in Metro Vancouver* increased to start the summer, with home sales up nearly ten per cent year-over-year in June.

Read

Market Update.

Sales Struggle Against a Weak Economy and Rising Mortgage Rates.

Vancouver, BC – June 11, 2026.

The British Columbia Real Estate Association (BCREA) reports that 6,790 residential unit sales were recorded in Multiple Listing Service® (MLS®) Systems in May 2026, down 2 per cent from May 2025. The average MLS® residential price in BC in May 2026 was down 1.4 per cent at $945,878 compared to $959,216 in May 2025.


chart

Total MLS® residential sales dollar volume was $6.42 billion, down 3.4 per cent from the same time the previous year. BC MLS® unit sales were 26.39 per cent lower than the ten-year average for the month of May.

“Rising mortgage rates and a weak labour market continue to constrain activity around the province but especially in the Lower Mainland,” said BCREA Chief Economist Brendon Ogmundson. “The recent rise in mortgage rates presents an unexpected headwind for the market this year and may further delay a recovery in activity.”

Year-to-date, BC residential sales dollar volume is down 8 per cent to $25.1 billion, compared with the same period in 2025. Residential unit sales are down 6.9 per cent year-over-year at 26,681 units, while the average MLS® residential price is also down 1.2 per cent to $941,883.


table


Read

Market Review.
Apartment sales lag, other housing segments steady.

Vancouver, BC – June 2, 2026.


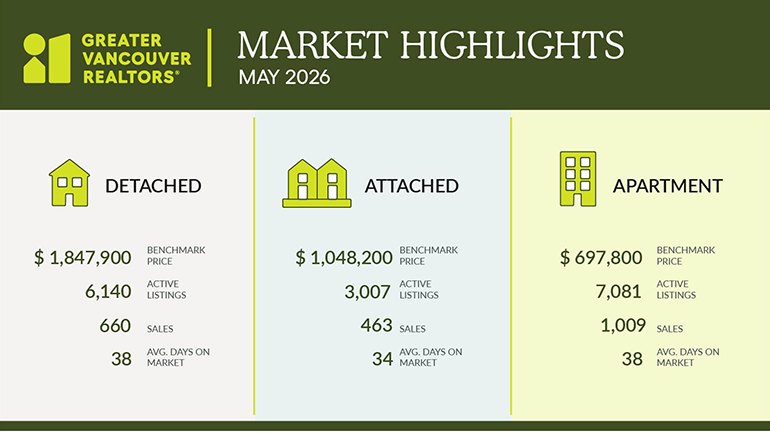
Led by slow sales in the apartment segment, home sales registered on the MLS® in Metro Vancouver* were down nearly four per cent in May compared to last year.

The Greater Vancouver REALTORS® (GVR) reports that residential sales in the region totalled 2,150 in May 2026, a 3.5 per cent decrease from the 2,228 sales recorded in May 2025. This was 26.6 per cent below the 10-year seasonal average (2,930). 

“While attached sales held relatively steady and detached sales edged up roughly one per cent in May, apartment sales were down about seven per cent year-over-year, which weighed down the overall sales total,” said Andrew Lis, GVR chief economist and vice-president data analytics. “Even then, apartment sales were not down uniformly across all regions – some of the larger areas such as North and East Vancouver saw increases relative to last year.”

There were 6,115 detached, attached and apartment properties newly listed for sale on the Multiple Listing Service® (MLS®) in Metro Vancouver in May 2026. This represents a 7.6 per cent decrease compared to the 6,620 properties listed in May 2025. This was 1.3 per cent above the 10-year seasonal average (6,036). 

The total number of properties currently listed for sale on the MLS® system in Metro Vancouver is 16,917, a one per cent decrease compared to May 2025 (17,094). This is 34.6 per cent above the 10-year seasonal average (12,567). 

Across all detached, attached and apartment property types, the sales-to-active listings ratio for May 2026 is 13.1 per cent. By property type, the ratio is 10.7 per cent for detached homes, 15.4 per cent for attached, and 14.2 per cent for apartments. 

Analysis of the historical data suggests downward pressure on home prices occurs when the ratio dips below 12 per cent for a sustained period, while home prices often experience upward pressure when it surpasses 20 per cent over several months. 

“Price trends across all housing types were flat month-over-month, as a healthy level of inventory easily absorbed the relatively muted level of overall demand in the market,” Lis said. “Year-to-date, sales have come in just shy of our forecast to this point in the year. With demand tracking our forecast so closely, it’s reasonable to expect a calm and orderly summer market, as no obvious near-term catalysts loom over the horizon to move the market significantly in either direction.”  

The MLS® Home Price Index composite benchmark price for all residential properties in Metro Vancouver is currently $1,100,700. This represents a 6.2 per cent decrease over May 2025 and a 0.2 per cent increase compared to April 2026. 

Sales of detached homes in May 2026 reached 660, a 0.9 per cent increase from the 654 detached sales recorded in May 2025. The benchmark price for a detached home is $1,847,900. This represents a 6.9 per cent decrease from May 2025 and a 0.4 per cent increase compared to April 2026. 

Sales of apartment homes reached 1,009 in May 2026, a 7.2 per cent decrease compared to the 1,087 sales in May 2025. The benchmark price of an apartment home is $697,800. This represents a 7.9 per cent decrease from May 2025 and a 0.7 per cent decrease compared to April 2026. 

Attached home sales in May 2026 totalled 463, a 1.3 per cent decrease compared to the 469 sales in May 2025. The benchmark price of a townhouse is $1,048,200. This represents a 5.1 per cent decrease from May 2025 and a 0.5 per cent increase compared to April 2026. 

Read

Market Update.

Market Activity Endures Through Foreign and Domestic Headwinds.

Vancouver, BC – May 11, 2026
.

The British Columbia Real Estate Association (BCREA) reports that 6,311 residential unit sales were recorded in Multiple Listing Service® (MLS®) Systems in April 2026, down 1.9 per cent from April 2025. The average MLS® residential price in BC in April 2026 was up 0.8 per cent at $952,768 compared to $944,796 in April 2025.

chart

Total MLS® residential sales dollar volume was $6.01 billion, down 1.1 per cent from the same time the previous year. BC MLS® unit sales were 25.38 per cent lower than the ten-year average for the month of April.

“Challenges in the local economy and labour market, combined with upward pressure on rates due to the ongoing oil supply shock, are continuing to suppress pent-up demand and weaken overall market activity,” said BCREA Chief Economist Brendon Ogmundson. “However, modest monthly gains (seasonally adjusted) in some regions hopefully depict the beginning of a broader stabilization in housing activity, underpinned by improved affordability conditions that should encourage prospective buyers to enter the market.”

Year-to-date, BC residential sales dollar volume is down 9.5 per cent to $18.7 billion, compared with the same period in 2025. Residential unit sales are down 7.6 per cent year-over-year at 20,059 units, while the average MLS® residential price is also down 2 per cent to $932,492.


table
 
 
Read

Market Review.

Diverging trends widen as detached housing gains steam.

May 04, 2026.

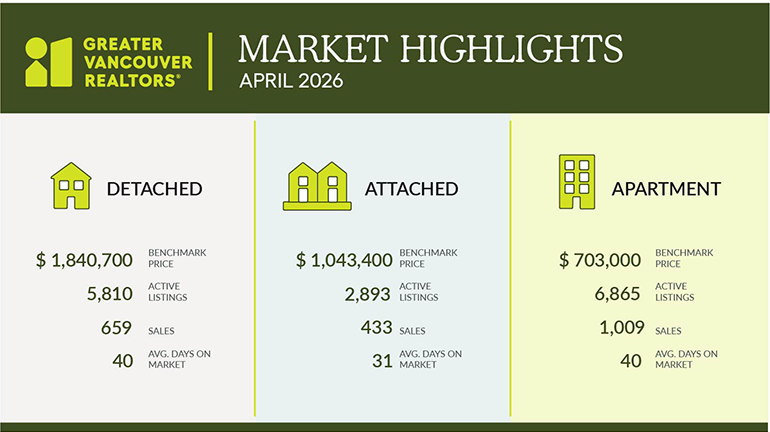
Home sales registered on the MLS® in Metro Vancouver remain relatively flat compared to April last year, but a divergence is emerging between market segments.

The Greater Vancouver REALTORS® (GVR) reports that residential sales in the region totalled 2,110 in April 2026, a 2.5 per cent decrease from the 2,163 sales recorded in April 2025. This was 22.9 per cent below the 10-year seasonal average (2,735).

“Last month we noted that a divergence was emerging between sales trends in the detached and multi-family segments, which continued in April,” said Andrew Lis, GVR chief economist and vice-president data analytics. “Sales of detached homes have been gaining year-over-year, while sales in the multi-family segment have declined, and this pattern is consistent across most areas. The fact this pattern is so broad-based reduces the likelihood what we’re seeing is just a blip in the data since the momentum isn’t isolated to small pockets of the market.”

There were 6,684 detached, attached and apartment properties newly listed for sale on the Multiple Listing Service® (MLS®) in Metro Vancouver in April 2026. This represents a 2.4 per cent decrease compared to the 6,850 properties listed in April 2025. This was 15.5 per cent above the 10-year seasonal average (5,785).

The total number of properties currently listed for sale on the MLS® system in Metro Vancouver is 16,236, a 0.2 per cent increase compared to April 2025 (16,207). This is 37.9 per cent above the 10-year seasonal average (11,773).

Across all detached, attached and apartment property types, the sales-to-active listings ratio for April 2026 is 13.5 per cent. By property type, the ratio is 11.3 per cent for detached homes, 15 per cent for attached, and 14.7 per cent for apartments.

Analysis of the historical data suggests downward pressure on home prices occurs when the ratio dips below 12 per cent for a sustained period, while home prices often experience upward pressure when it surpasses 20 per cent over several months.

“While it’s not always the case, there have been periods where the detached segment has acted as a bellwether of market sentiment, and it’s a question whether this time around this might be the case,” Lis said. “Prices across all segments remain relatively flat month over month as inventory levels remain sufficient to keep price escalation at bay. But with the detached segment picking up steam heading into the full swing of spring, it may only be a matter of time until the multi-family segments follow suit, which would slowly draw down standing inventory levels unless a surge of sellers come to market with their properties. We’ll be watching the next few months of data closely to see if pent-up demand re-enters the market heading into summer.”

The MLS® Home Price Index composite benchmark price for all residential properties in Metro Vancouver is currently $1,098,000. This represents a 6.9 per cent decrease over April 2025 and a 0.6 per cent decrease compared to March 2026.

Sales of detached homes in April 2026 reached 659, a 14 per cent increase from the 578 detached sales recorded in April 2025. The benchmark price for a detached home is $1,840,700. This represents an 8.3 per cent decrease from April 2025 and a 0.8 per cent decrease compared to March 2026.

Sales of apartment homes reached 1,009 in April 2026, a 10.7 per cent decrease compared to the 1,130 sales in April 2025. The benchmark price of an apartment home is $703,000. This represents a 7.9 per cent decrease from April 2025 and a 0.5 per cent decrease compared to March 2026.

Attached home sales in April 2026 totalled 433, a two per cent decrease compared to the 442 sales in April 2025. The benchmark price of a townhouse is $1,043,400. This represents a 5.1 per cent decrease from April 2025 and a 0.4 per cent decrease compared to March 2026.


Read

Market Update.

Home Sales Remain Slow Amidst Very Challenging Economic Environment.

Vancouver, BC – April 15, 2026.

The British Columbia Real Estate Association (BCREA) reports that 5,766 residential unit sales were recorded in Multiple Listing Service® (MLS®) Systems in March 2026, down 3.6 per cent from March 2025. The average MLS® residential price in BC in March 2026 was down 2 per cent at $939,846 compared to $959,236 in March 2025.

chart

Total MLS® residential sales dollar volume was $4.21 billion, down 5.6 per cent from the same time the previous year. BC MLS® unit sales were 34.53 per cent lower than the ten-year average for the month of March.

“Global conflict leading to rising mortgage rates paired with a sluggish economy are presenting a challenge for a housing market recovery,” said BCREA Chief Economist Brendon Ogmundson. “Improved affordability and pent-up demand should translate to an acceleration of activity, though the market will need a period of relative calm for households to build confidence.”

Year-to-date, BC residential sales dollar volume is down 13 per cent to $12.7 billion, compared with the same period in 2025. Residential unit sales are down 11 per cent year-over-year at 13,595 units, while the average MLS® residential price is also down 2.2 per cent to $933,859.


table


Read

Market Review.

Buyers and sellers adopting a wait-and-see approach to housing market.

Vancouver, BC – April 2, 2026

Home sales registered on the MLS® in Metro Vancouver*continue evolving at a pace similar to last year, with the sales down roughly three per centfrom last March.

The Greater Vancouver REALTORS® (GVR) reports that residential sales in the region totalled 2,032 in March 2026, a 2.8 per cent decrease from the 2,091 sales recorded in March 2025.

This was 31.8 per cent below the 10-year seasonal average (2,981).

“Year-to-date, sales are tracking our forecast for the year closely, and the weakness in
demand we continue to observe at the aggregate level is unsurprising,” said Andrew Lis, GVR chief economist and vice-president data analytics.

“What’s interesting is that the aggregate total masks an emerging divergence among market segments. While the multifamilysegment continues to see slower sales, the detached segment may be awakening with sales up, and new listings down from last year.”

There were 5,792 detached, attached and apartment properties newly listed for sale on the Multiple Listing Service® (MLS®) in Metro Vancouver in March 2026. This represents a 10.3 per cent decrease compared to the 6,455 properties listed in March 2025. This was 4.9 per cent above the 10-year seasonal average (5,521).

The total number of properties currently listed for sale on the MLS® system in Metro
Vancouver is 14,774, a 1.6 per cent increase compared to March 2025 (14,546). This is 38 per cent above the 10-year seasonal average (10,704).

Across all detached, attached and apartment property types, the sales-to-active listings ratio for March 2026 is 14.2 per cent. By property type, the ratio is 11 per cent for detached homes,17.2 per cent for attached, and 15.7 per cent for apartments.

Analysis of the historical data suggests downward pressure on home prices occurs when the ratio dips below 12 per cent for a sustained period, while home prices often experience upward pressure when it surpasses 20 per cent over several months.

Read

Market Update.

Market Activity Flounders Throughout the Province.

Vancouver, BC – March 12, 2026.

The British Columbia Real Estate Association (BCREA) reports that 4,516 residential unit sales were recorded in Multiple Listing Service® (MLS®) Systems in February 2026, down 9.7 per cent from February 2025. The average MLS® residential price in BC in February 2026 was down 2.9 per cent at $932,243 compared to $960,572 in February 2025.

chart

Total MLS® residential sales dollar volume was $4.21 billion, down 12.3 per cent from the same time the previous year. BC MLS® unit sales were 32.87 per cent lower than the ten-year average for the month of February.

“Housing market activity continues to struggle, with sales declining from every region in the province compared to the same time last year,” said BCREA Chief Economist Brendon Ogmundson. “We hope that improved affordability conditions in most regions and stable rates will motivate prospective demand to enter the market and drive stronger sales activity over the rest of the year.”

Year-to-date, BC residential sales dollar volume is down 17.8 per cent to $7.3 billion, compared with the same period in 2025. Residential unit sales are down 15.8 per cent year-over-year at 7,832 units, while the average MLS® residential price is also down 2.4 per cent to $929,323.

table

Read

Market Review.

New normal for Metro Vancouver’s housing market continues.

March 3, 2026.

Metro Vancouver home sales registered on the MLS® in February continued the recent trend of slower-than-average sales, seeing a ten per cent decline over the same period last year.

The Greater Vancouver REALTORS® (GVR) reports that residential sales in the region totalled 1,648 in February 2026, a 9.8 per cent decrease from the 1,827 sales recorded in February 2025. This was 28.7 per cent below the 10-year seasonal average (2,310).

“With each passing data point, the pace of sales running well-below long-term averages are no longer a surprise – it’s become the new norm,” said Andrew Lis, GVR chief economist and vice-president data analytics. “A surprising finding this February, however, is that home sellers appear less eager to list their homes relative to last year with new listings down about seven percent, mostly driven by fewer listings in the apartment segment.”

There were 4,734 detached, attached and apartment properties newly listed for sale on the Multiple Listing Service® (MLS®) in Metro Vancouver in February 2026. This represents a 6.4 per cent decrease compared to the 5,057 properties listed in February 2025. This was 7.1 per cent above the 10-year seasonal average (4,421).

The total number of properties currently listed for sale on the MLS® system in Metro Vancouver is 13,545, a 6.3 per cent increase compared to February 2025 (12,744). This is 37 per cent above the 10-year seasonal average (9,886).

Across all detached, attached and apartment property types, the sales-to-active listings ratio for February 2026 is 12.6 per cent. By property type, the ratio is nine per cent for detached homes, 16.6 per cent for attached, and 14.1 per cent for apartments.

Analysis of the historical data suggests downward pressure on home prices occurs when the ratio dips below 12 per cent for a sustained period, while home prices often experience upward pressure when it surpasses 20 per cent over several months.

“With fewer sellers coming to market with their properties than last year, a pick-up in demand heading into the spring could result in a stagnation of standing inventory, which may support prices around current levels,” Lis said. “With sales slightly outpacing our 2026 forecast year-to-date, the spring market will be the litmus test of whether we continue along this new normal, or if we see any significant surprises.”

The MLS® Home Price Index composite benchmark price for all residential properties in Metro Vancouver is currently $1,100,300. This represents a 6.8 per cent decrease over February 2025 and a 0.1 per cent decrease compared to January 2026.

Sales of detached homes in February 2026 reached 427, a 10.5 per cent decrease from the 477 detached sales recorded in February 2025. The benchmark price for a detached home is $1,835,900. This represents an 8.8 per cent decrease from February 2025 and a 0.8 per cent decrease compared to January 2026.

Sales of apartment homes reached 824 in February 2026, a 15.6 per cent decrease compared to the 976 sales in February 2025. The benchmark price of an apartment home is $708,200. This represents a 6.8 per cent decrease from February 2025 and a 0.5 per cent increase compared to January 2026.

Attached home sales in February 2026 totalled 387, a 7.8 per cent increase compared to the 359 sales in February 2025. The benchmark price of a townhouse is $1,046,100. This represents a 5.6 per cent decrease from February 2025 and a 0.3 per cent increase compared to January 2026.


Read

I am committed to assisting you during your real estate transaction...

"EVERY STEP of THE WAY"
 
Please contact me at 604.649.1541 or email dsmccarthy@shaw.ca to be of further assistance.

Reciprocity Logo The data relating to real estate on this website comes in part from the MLS® Reciprocity program of either the Greater Vancouver REALTORS® (GVR), the Fraser Valley Real Estate Board (FVREB) or the Chilliwack and District Real Estate Board (CADREB). Real estate listings held by participating real estate firms are marked with the MLS® logo and detailed information about the listing includes the name of the listing agent. This representation is based in whole or part on data generated by either the GVR, the FVREB or the CADREB which assumes no responsibility for its accuracy. The materials contained on this page may not be reproduced without the express written consent of either the GVR, the FVREB or the CADREB.